
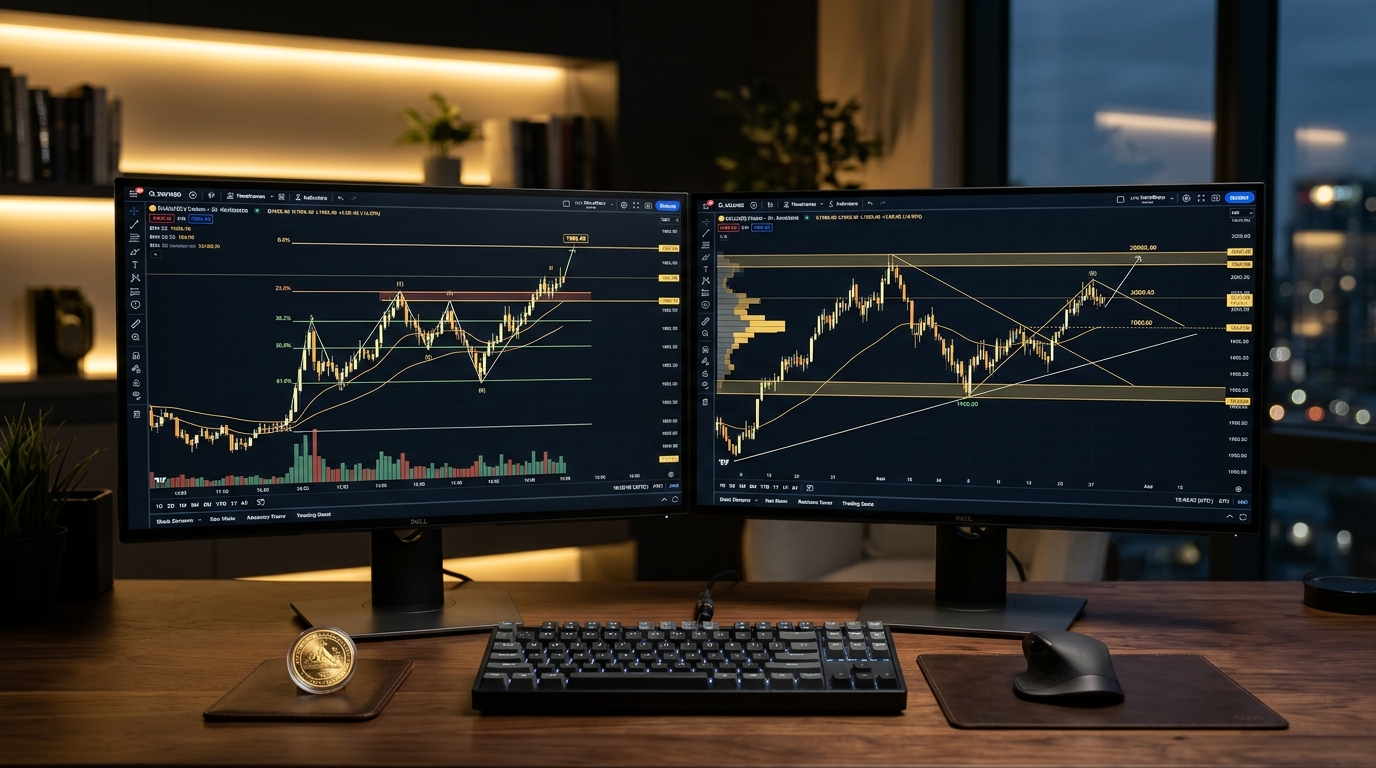
BelajarGold — Educational & Technical Strategy Guide. Whenever macroeconomic calendars flag high-impact releases such as US Retail Sales, Non-Farm Payrolls (NFP), or the Consumer Price Index (CPI), spot gold (XAU/USD) experiences explosive volume expansions. For the vast majority of retail participants, however, news volatility becomes an account-destroying hazard due to violent two-way whipsaws.
Why do whipsaws occur, and how do institutional desks navigate these catalyst events profitably without reckless gambling? The answer lies in understanding the news liquidity life cycle and mastering the Second Wave Entry execution protocol.
The 4 Phases of News Volatility Dynamics
When high-impact US macro prints cross the tape at 20:30 WIB (London–New York overlap session), gold price action consistently traverses four distinct liquidity phases:
| Phase | Time Window | Liquidity & Spread Conditions | Market Participant Dynamics | Prudent Trader Action |
|---|---|---|---|---|
| Phase 1: Pre-Release Freeze | 15–0 minutes before 20:30 WIB | Liquidity thins rapidly; broker spreads widen 2x to 3x | Institutional desks pull standing limit orders to prevent adverse selection | Close open high-risk scalps; refrain from initiating new positions |
| Phase 2: Knee-Jerk Spike & Whipsaw | 0 – 5 minutes post-release (20:30–20:35 WIB) | Extreme spreads; high slippage; 40–80 pip swings in sub-second intervals | High-Frequency Trading (HFT) algorithms execute automated headline keyword models | Hands-Off: Let algorithmic desks burn through trapped retail liquidity |
| Phase 3: The Second Wave (Retest & Real Flow) | 5 – 25 minutes post-release (20:35–20:55 WIB) | Spreads normalize; market depth rebuilds | Discretionary institutional traders digest core figures, revisions, and macro trends | The Execution Window: Identify pullback retests at Fair Value Gaps / Order Blocks |
| Phase 4: Sustained Trend Expansion | 30 – 120 minutes post-release (21:00 WIB onwards) | Full New York banking liquidity fully engaged | Persistent directional trend aligning with US Treasury yield curves and DXY | Trend continuation; deploy trailing stops to maximize profit extraction |
The Fatal Pitfall of Pre-News Straddle Traps
Outdated trading materials frequently suggest placing simultaneous Buy Stop and Sell Stop pending orders a few pips away just prior to the news release. In modern algorithmic markets, this technique is fatal due to three structural risks:
- Spread Blowout: Seconds prior to the print, standard 1.5-pip spreads frequently balloon to 15–25 pips, triggering both orders instantly into an immediate double loss.
- Severe Negative Slippage: In millisecond order flow, a buy stop placed at $4,080 may fill at $4,087, burdening the trade with massive immediate drawdown.
- Double Stop Runs: Market makers routinely probe both the upper and lower extremes of the Asian range before committing to the genuine macro trend.
The Step-by-Step "Second Wave Entry" Blueprint
The Second Wave methodology exploits the reality that following the initial knee-jerk surge, prices almost invariably retest or pull back to resolve imbalances (Fair Value Gaps):
- Step 1: Observe the First 5-Minute (M5) Candle: Allow the 20:30–20:35 WIB candle to close completely. Note the candle's body size and closing direction.
- Step 2: Map the Discount Retest Zone (50%–61.8% Fibonacci): Anchor a Fibonacci retracement from the initial spike's swing low to its swing high. The 50%–61.8% retracement marks the prime discount zone.
- Step 3: Await M1/M5 Rejection Confirmation: When price probes the discount pool, look for pin bars or bullish engulfing candles indicating institutional absorption.
- Step 4: Anchor Defensive Stops: Position invalidation stops just beyond the original news spike's structural anchor, ensuring strictly defined risk parameters.
Deepen your understanding of market sessions in our guide: Mastering Gold Trading Sessions, and protect your capital via the Risk Management Module.