
Fibonacci retracement is used to estimate how deep a pullback might go before the trend continues.
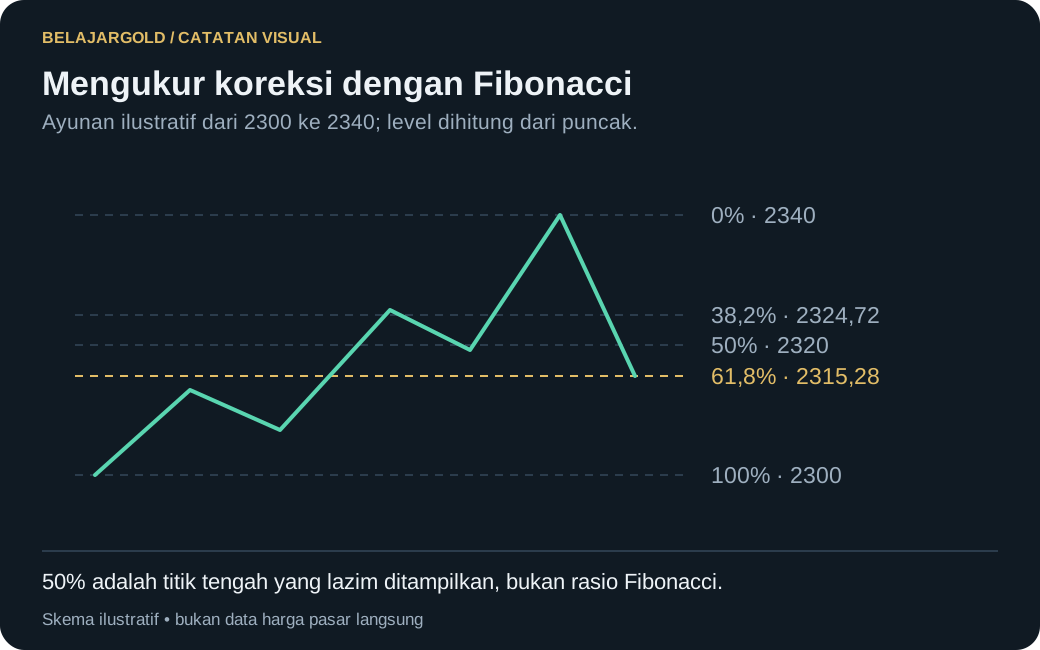
Steps
- Identify one clear swing: from swing low to swing high for an uptrend.
- Draw the Fibonacci tool from the start point to the end point of that swing.
- Watch the 38.2% – 50% – 61.8% levels as the commonly observed pullback area.
Be consistent in how you draw it (e.g. always body-to-body or always wick-to-wick).
Save your learning progress
Sign up free to mark lessons as completed and unlock all member lessons.
Sign Up Free
Risk disclaimer: all content on this site is provided for educational purposes and is not financial advice, signals, an invitation to trade, or a promise of profit. Trading carries a high risk and may result in the loss of part or all of your capital. Check the legality of service providers in your jurisdiction.