
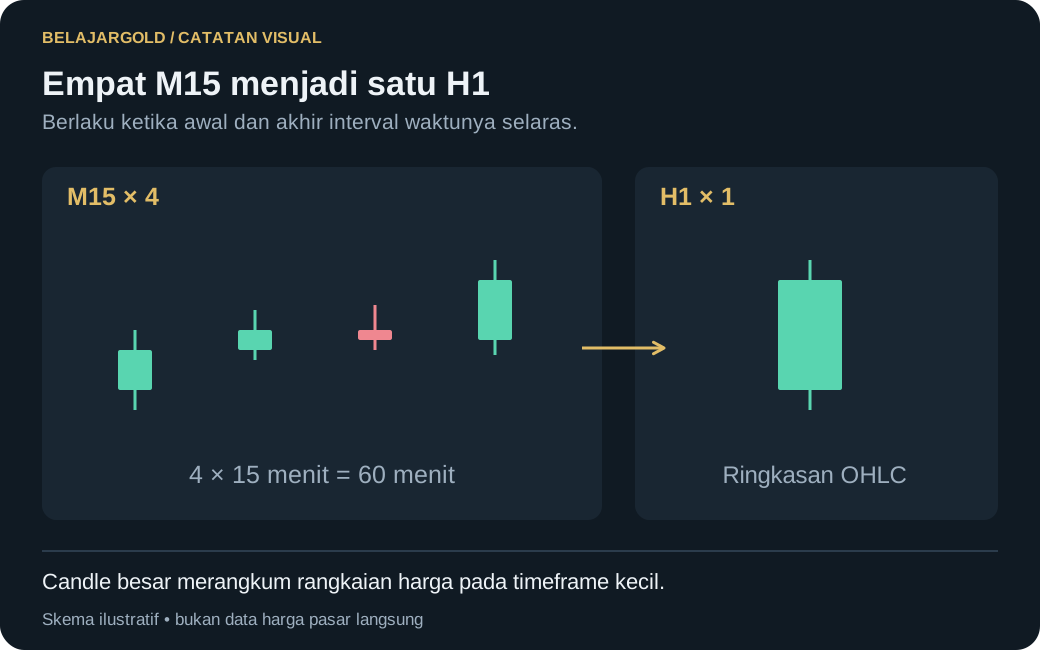
A timeframe is the duration represented by a single candle. On an H1 chart, one candle = 1 hour of price movement.
Common timeframes
- Higher (D1, H4): the big picture, the main direction, key levels.
- Middle (H1, M30): building scenarios and entry areas.
- Lower (M15, M5): more precise entry timing.
Multi-timeframe
A common approach: set your bias on a higher timeframe, then look for entries on a lower timeframe in the same direction as that bias. Analyzing a single timeframe alone is easily misleading.
Chart types
- Candlestick — the most informative; shows open, high, low, and close. Covered in depth in Module 6.
- Line — closing prices only; useful for seeing the overall shape.
Key points
- There is no "best" timeframe — only one that fits your style and the time you have available.
- Always confirm direction on a higher timeframe.
Save your learning progress
Sign up free to mark lessons as completed and unlock all member lessons.
Sign Up Free
Risk disclaimer: all content on this site is provided for educational purposes and is not financial advice, signals, an invitation to trade, or a promise of profit. Trading carries a high risk and may result in the loss of part or all of your capital. Check the legality of service providers in your jurisdiction.