
The easiest reversal pattern to recognize.
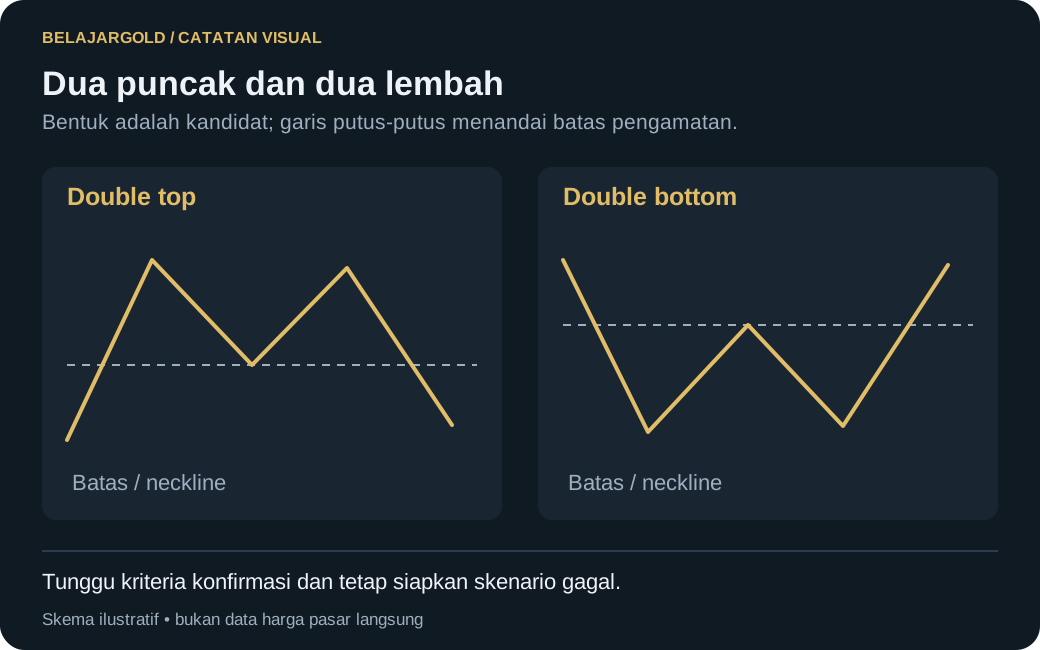
Double top
- Two highs at a similar price level, separated by one low (the neckline).
- Appears after an uptrend. Shows that buyers failed to make a higher high.
- Trigger: price breaks and closes below the neckline.
- Stop: above the second high.
- Target: the height of the pattern (high → neckline) projected downward from the neckline.
Double bottom
The mirror image: two similar lows after a downtrend, triggered when price breaks above the neckline.
Key points
- The highs/lows do not have to be exactly equal — a close range is enough.
- Confirm with a close through the neckline, not just a touch.
Save your learning progress
Sign up free to mark lessons as completed and unlock all member lessons.
Sign Up Free
Risk disclaimer: all content on this site is provided for educational purposes and is not financial advice, signals, an invitation to trade, or a promise of profit. Trading carries a high risk and may result in the loss of part or all of your capital. Check the legality of service providers in your jurisdiction.