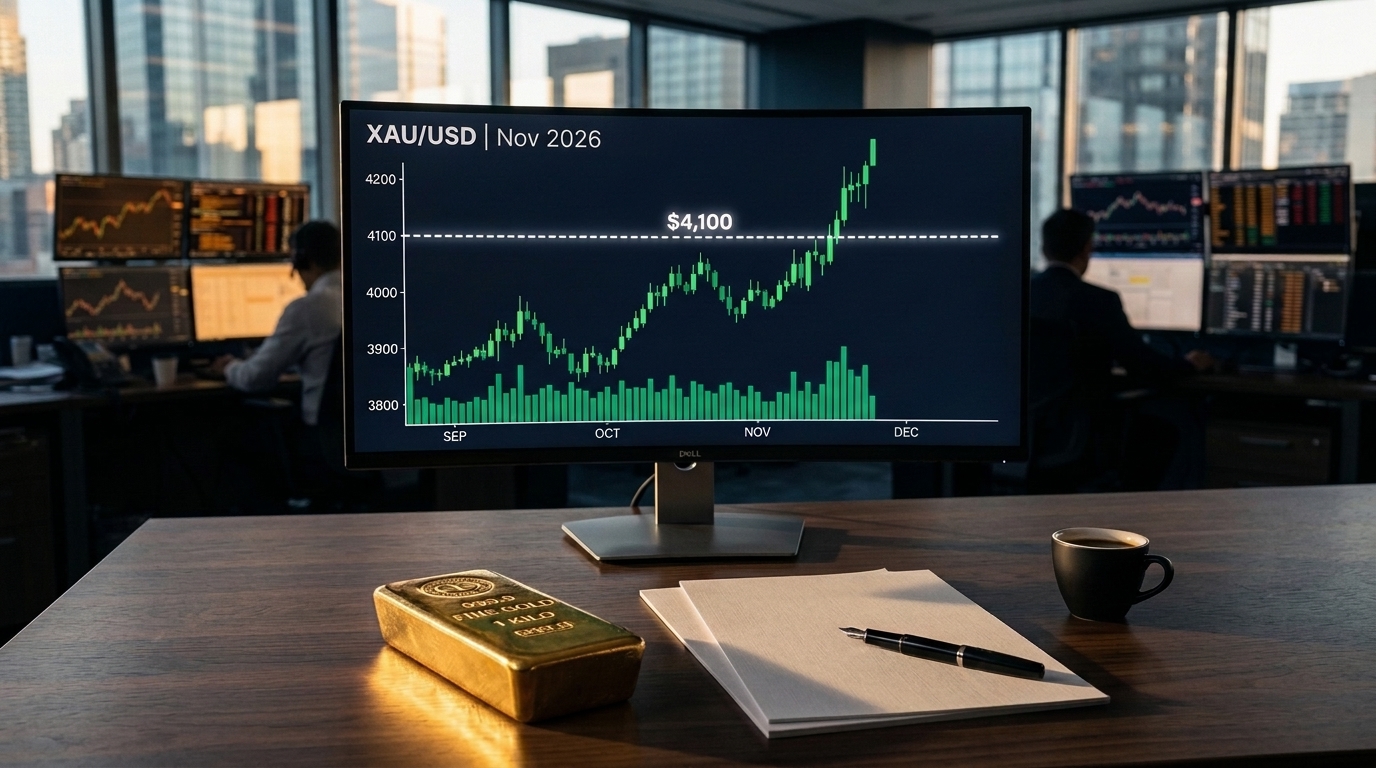

BelajarGold — Daily Market Analysis (Thursday, 19 November 2026). Spot gold (XAU/USD) enters Thursday's session under sustained selling pressure. Following yesterday's steep 3.47% sell-off from ~$3,854 that decisively shattered the psychological $3,800 handle, bullion briefly carved out a fresh 14-month low near $3,693 per troy ounce before attempting a fragile stabilization around $3,720–$3,740.
Three Macro Catalysts Driving Gold's Pullback
Bullion remains weighed down by a convergence of restrictive Federal Reserve expectations, resilient US economic prints, and elevated sovereign bond yields:
- Hawkish October FOMC Minutes: Minutes from the October 27–28 FOMC meeting reaffirmed policymakers' determination to return inflation to 2%. Several officials—echoed by hawkish remarks from Governor Christopher Waller—highlighted upside inflation risks tied to energy costs, supply constraints, and surging AI infrastructure debt accumulation. Interest-rate futures now price in a 90%–95% probability of a 25 bps rate hike at the December 8–9 FOMC meeting.
- Resilient US Labor & Manufacturing Data (198K Claims & 20.6 Philly Fed): Weekly Initial Jobless Claims printed at a low 198,000 (matching tight 198K–200K forecasts), while the Philadelphia Fed Manufacturing Index remained firmly in expansion at 20.6 (vs 20.9 prior). Combined with October Retail Sales control-group strength (+0.6% MoM) and +1.1% import price growth, the US economy continues to give the Fed room to stay restrictive.
- Surging US Dollar & 10-Year Treasury Yields Above 5.1%: The US Dollar Index (DXY) hovers near 19-month peaks around 103.50–103.96, while 10-year Treasury yields hold above 5.12%, sharply raising the opportunity cost of holding non-yielding gold.
Geopolitical Paradox: Strait of Hormuz Risks vs. Tight Policy
Despite escalating Middle East security risks—including naval mine incidents affecting oil tankers in the Strait of Hormuz and an International Energy Agency (IEA) warning on global energy security alongside US-Israel-Iran tensions—traditional safe-haven flows have been muted in the short term. Energy-driven inflation risks reinforce the Fed's hawkish stance, keeping the US dollar dominant even as long-term central bank accumulation continues to provide a structural floor beneath bullion.
Track scheduled releases and macro figures on the BelajarGold Economic Calendar.
| Level Tier | Price (USD/oz) | Technical Significance | Anticipated Price Action |
|---|---|---|---|
| Resistance 2 (R2) | $3,800 – $3,850 | Broken psychological floor & prior breakdown zone | Major institutional supply barrier capping rallies while daily trend stays bearish |
| Resistance 1 (R1) | $3,758 – $3,770 | Intraday high & near-term technical bounce ceiling | First upside target on short-covering relief rallies from oversold readings |
| Intraday Pivot | $3,725 – $3,735 | Asian–European equilibrium battleground | Determines intraday control between bearish continuation and corrective rebound |
| Support 1 (S1) | $3,693 – $3,700 | 14-month low & psychological defense floor | Key buyer defense; a clean breakdown opens accelerated downside momentum |
| Support 2 (S2) | $3,600 – $3,625 | Lower structural demand & bearish channel target | Next psychological downside zone if DXY breaks cleanly above 104.00 |
Technical Picture: Bearish Structure Meets Oversold RSI
Across 4-hour and Daily charts, XAU/USD trades well below its 50-day and 100-day moving averages, keeping the broader structure tilted downward. However, the 14-day Relative Strength Index (RSI) is hovering near oversold territory (~31). Stretched momentum leaves gold vulnerable to abrupt short-covering relief bounces toward $3,758–$3,770 before institutional desks commit to the next directional leg.
Risk Management Guidelines for Today
- Avoid Shorting Directly Into $3,693–$3,700 Support: Chasing red candles near multi-month lows carries high squeeze risk. Wait for either a controlled bounce into resistance or a confirmed H1 breakdown and retest.
- Watch DXY 104.00 & 10Y Yields: While DXY holds above 103.50 and 10-year yields remain above 5.10%, rebounds are likely to face "sell-on-strength" supply.
- Size Positions for High Volatility: With daily ranges stretching $60–$100/oz, calculate exact position sizing via our Risk Management Module.
Deepen your execution framework in today's strategy guide: Trading Relief Bounces When Gold Turns Oversold, and review labor data mechanics in Understanding Initial Jobless Claims & PPI for Gold.